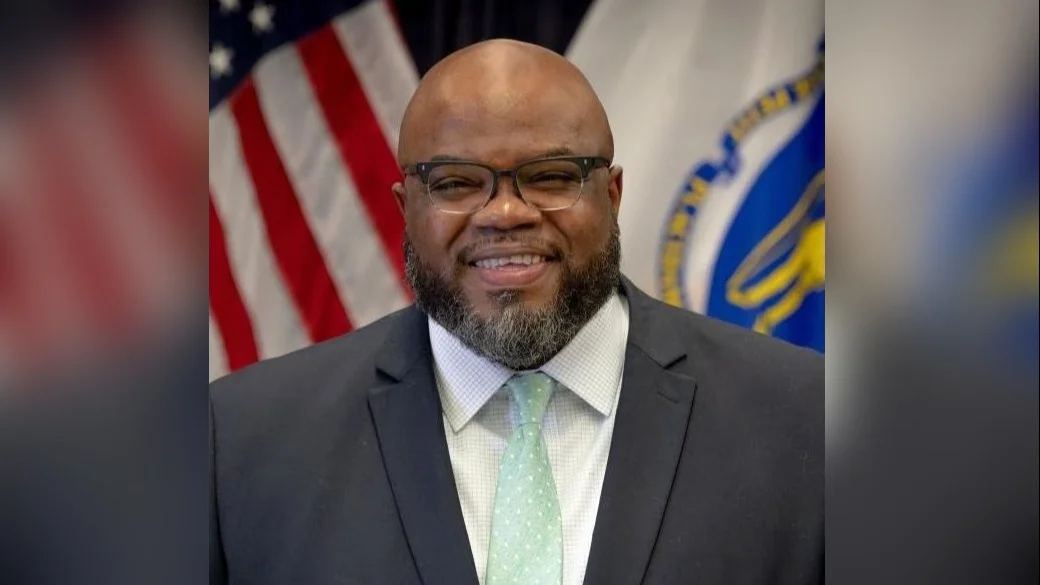
Patrick Tutwiler Massachusetts Secretary of Education | https://www.mass.gov/info-details/secretary-of-education#:~:text=As%20Massachusetts%20Secretary%20of%20Education,the%20University%20of%20Massachusetts%20system.
Patrick Tutwiler Massachusetts Secretary of Education | https://www.mass.gov/info-details/secretary-of-education#:~:text=As%20Massachusetts%20Secretary%20of%20Education,the%20University%20of%20Massachusetts%20system.
In total, there were 217 Hispanic or Latino students enrolled, accounting for 61.9% of the district's student body.
The number of Hispanic or Latino students attending schools in the district decreased 3.1% from the previous school year.
Meanwhile, American Indian or Alaska Native students were the least represented ethnic group within the schools in Martin Luther King, Jr. Charter School of Excellence District.
Martin Luther King, Jr. Charter School of Excellence District roughly covers schools within Hampden County, and has a main office in Springfield.
The total number of students attending the district’s schools grew to 352 over the 2022-23 school year.
Students in Massachusetts are predominantly white, according to state data from 2023-24, representing 53% of the state's student body.
Across the state, Hispanic and Latino students saw the highest high school dropout rates.
Under representation is also found among educators in Massachusetts. The Rennie Center reported that only 7.8% of teachers identified as people of color in 2022.
| Ethnic group | Percent of Total Student Body |
|---|---|
| Hispanic or Latino | 61.9% |
| Black or African American | 30.4% |
| Multiracial | 2.6% |
| White | 2% |
| Asian | 1.7% |
| American Indian or Alaska Native | 1.4% |

 Alerts Sign-up